Providing Rangeland Vegetation Monitoring Tools for Adaptive Monitoring and Management
Description
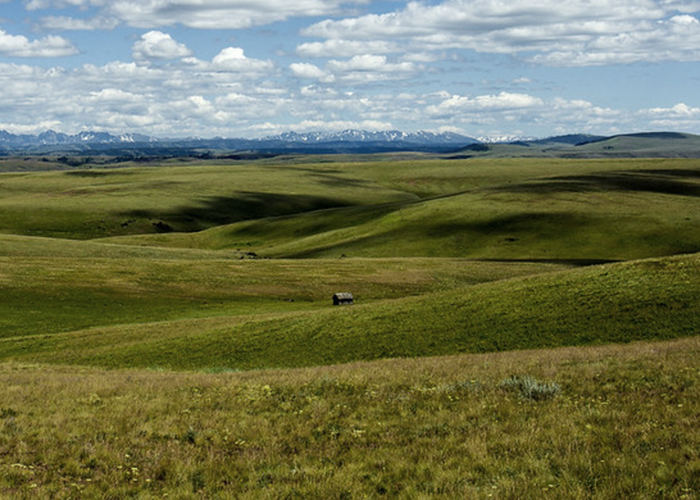
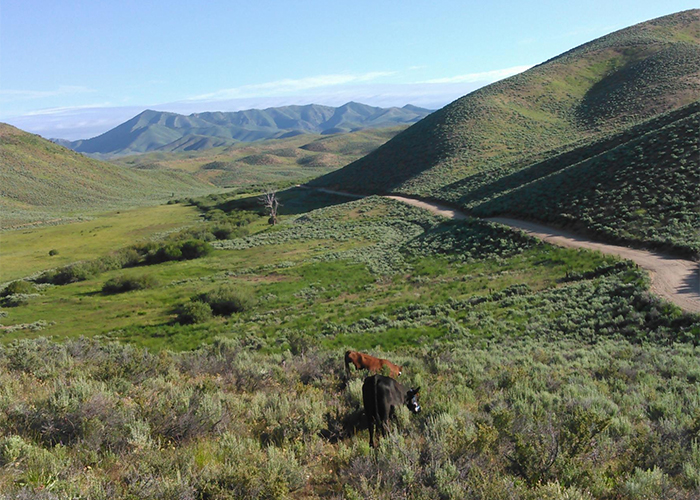
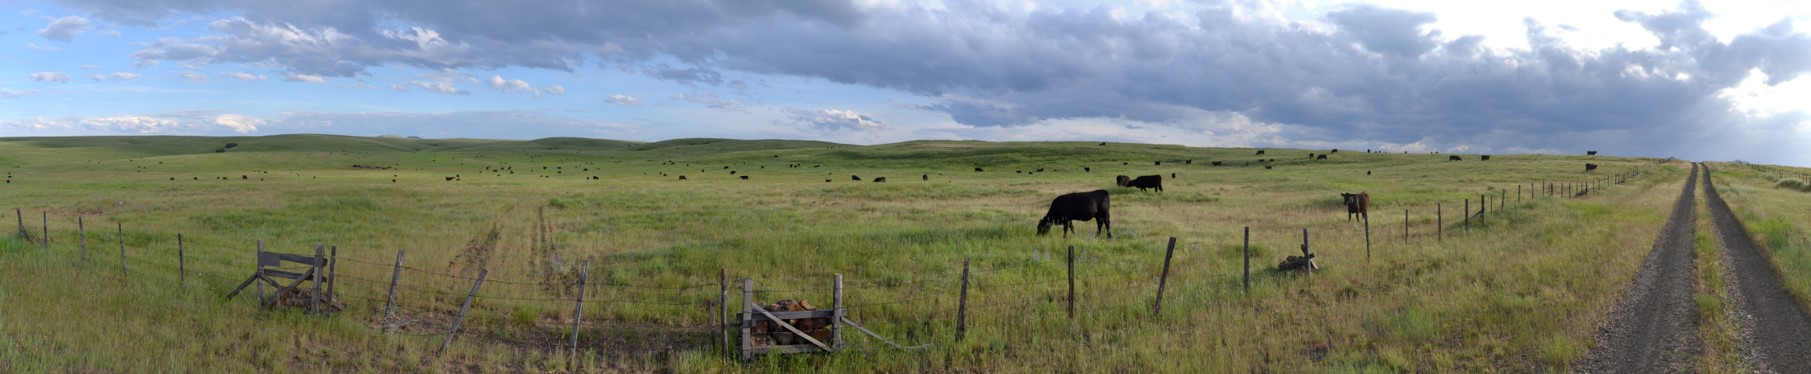
RangeSAT uses satellite data to generate maps and graphs of vegetation across pastures, ranches, and allotments. Using the record of Landsat data going back to 1984, the interface lets users easily view maps of vegetation amounts across their ranch or management area, at a single point in time or averaged across a month or a season. Vegetation amounts can also be displayed as graphs, allowing users to compare current vegetation amounts to past time periods. Climate variables (precipitation, potential evapotranspiration) can also be viewed alongside graphs of vegetation throughout a growing season.
RangeSAT is an ongoing project being developed at the University of Idaho, in partnership with The Nature Conservancy, Oregon Ranchers, the Natural Resources Conservation Service (NRCS), and the Northwest Climate Hub. Feedback, comments and questions can be directed to Vincent Jansen.
Data sources
Vegetation Data:
- Bunchgrass Prairie biomass and cover data: Jansen, et al., 2018
- Sagebrush Steppe: under development
Climate data:
- GridMet: Abatzoglou, 2011 (Climatology Lab)
References
Jansen, V.S., Kolden, C.A., Schmalz, H.J., Karl, J.W., Taylor, R.V. (2021). Using Satellite-Based Vegetation Data for Short-Term Grazing Monitoring to Inform Adaptive Management. Rangeland Ecology and Management, 76, doi.org/10.1016/j.rama.2021.01.006
Jansen, V. S., Kolden, C. A., Schmalz, H. J. (2018). The Development of Near Real-Time Biomass and Cover Estimates for Adaptive Rangeland Management Using Landsat 7 and Landsat 8 Surface Reflectance Products. Remote Sensing 10 (1), 1057. doi:10.3390/rs10071057
Abatzoglou, J. T. (2011). Development of gridded surface meteorological data for ecological applications and modelling. International Journal of Climatology, 33 (1), doi:10.1002/joc.3413
Sites
Affiliations
![]()
![]()

![]()